This week we’re excited to announce a new analytics page that will help you measure the success of your outreach across team, role, campaign, and more.
Alongside our existing Dashboard Charts tab, you’ll find a new tab for Analytics. Analytics is filled with powerful insights, allowing you to see important metrics about your team and company’s overall performance.
Using the Analytics data filters, you can see performance across teams, roles, and diversity initiatives. For example: if you’re curious about the success of your diversity outreach among your top three recruiters for engineering roles, you can leverage the filters to do just that!
Let’s run through the basics of the three primary filters to see how they work:
Filtering on Team Members:
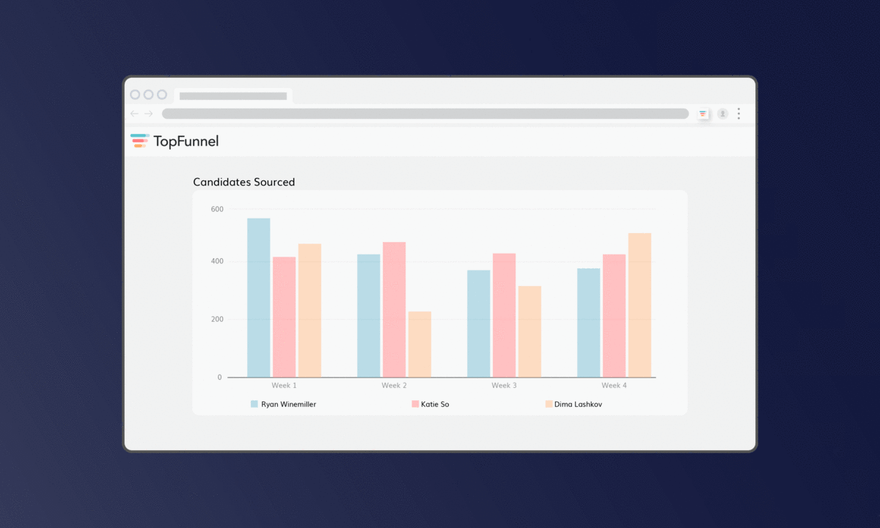
Depending on how your team is organized, you might be interested in only seeing a subset of the total outreach. To do this, filter on the user’s name in the Team Members selection box. Select as many team members as you like to filter the results by either the campaign owner or the sender.
Filtering on Role Type:
An exciting new addition to TopFunnel is the concept of Role Type! With Role Types, TopFunnel automatically infers the type of role you’re sourcing for with each campaign. We then categorize each outreach in one of the following Role Type categories:
- Analyst
- Designer
- Engineer
- Executive Assistant
- Finance
- Human Resources
- Leadership
- Marketing
- Product Manager
- Recruiter
- Sales
- Unknown
Using Role Type, you can narrow down on the metrics for your specific roles. Plus, just like the Team Members filter, you can combine many roles at once to dive into collections of comparable data.
Filtering on Candidate Type:
The third filter available to you in the new Analytics tab is Candidate Type. Here, you’ll be able to narrow down results to look at your team’s performance for gender, diversity, or veteran outreach, allowing you to gain more visibility into your strategic hiring efforts.
Additionally, you can mix any combination of the filters above to narrow in on precisely the subset of data you’re looking for. In the Analytics reporting panel, you’ll see a Leaderboard of your team’s top performers within the given filter criteria, as well as a table view containing the relevant filtered stats.
Finally, we’re surfacing statistics about all of TopFunnel’s and your team’s outreach within the Benchmark Data panel so you can compare the performance of your query against your team’s overall team performance and TopFunnel’s historical data.
With the new Analytics tab, you’ll gain further clarity into how your campaigns and team members are performing. We’re excited to see how you use these insights to enhance collaboration, iterate faster on what’s working, while gaining even greater visibility.
We’re always experimenting and iterating here at TopFunnel and would love to hear what you think about this new addition.